


When it comes to construction project scheduling, it requires a keen eye and precision. Throughout the many phases of construction projects, there are many variables in play at the same time. Attempting to oversee a whole project in its entirety can be immensely difficult. With multiple tasks, different crews, various timelines, general contractors and subcontractors, there are many aspects that project managers need to manage.
But luckily, there are many project management tools and different types of project management software to assist with making job scheduling easier. When you are able to have a visual overview of your project’s timeline, plans, and schedules, it makes it easier to stay on top of all your variables. This is where Gantt charts can be incredibly useful.
What is a Gantt Chart?
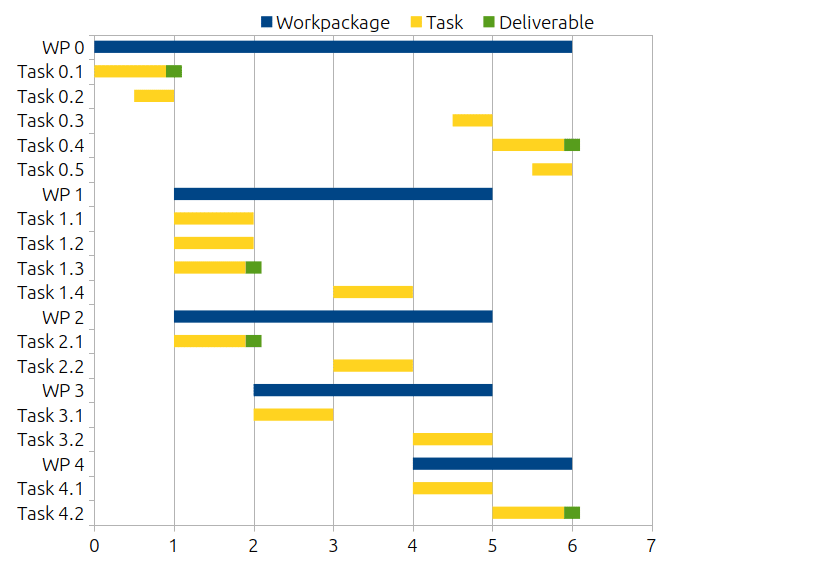
By definition, a Gantt chart is a type of bar chart that illustrates a project schedule and shows the dependency relationships between activities and current schedule status.
Essentially, a Gantt chart gives you a visual overview of all tasks against the construction timelines. Gantt charts display important information like who is assigned to which tasks, the estimated duration of tasks, and any overlapping activities within a project plan.
Gantt charts can help streamline your projects and make for ideal solutions when it comes to planning, avoiding delays, monitoring tasks, and completing projects by their finish date.
Why Use a Gantt Chart for Construction Project Scheduling?
When it comes to construction project schedules, there are many different phases and milestones throughout the whole construction management process that need to be accounted for and properly monitored. This is why a Gantt chart’s illustrative elements are so lucrative. Seeing the overall progress of multiple tasks during the construction management process and the overall timeline overview makes planning and scheduling much easier.
Gantt charts have proven to be incredibly useful. Some of their advantages include:
- Assessing how long a project may take.
- Determining which resources and materials are needed.
- Understanding dependencies between tasks.
- Planning the order of execution.
Visualize Project Progress at a Glance
The biggest advantage of Gantt charts is their visualization capabilities. Since Gantt charts are composed of several different bar charts that exist in a single desktop view, it makes it easier to prioritize tasks against each other and see any overlap that is occurring as well. All critical information is displayed in simple terms that are easy to understand and then categorized with task groups.
Construction scheduling software that utilizes a Gantt chart format is suitable for projects of all sizes and can easily show elements such as start-to-end dates, task dependencies (with progress trackers), order of tasks and more.
View Critical Project Information in Real-Time
With Gantt chart software features, critical information such as task dependencies, who is involved in which activity, and task progression are all tracked in real-time which allows project managers to make better-informed decisions. By having access to real-time information, there is a reduced chance of misinformation and delays, which means projects can be completed more efficiently and on time.
Improve Communication with Team Members & Stakeholders
One of the biggest challenges with any project can be miscommunication or lack of communication. There is no need to go into detail about how miscommunication can lead to project failures. Gantt charts provide crystal clear communication to all levels. Project managers can easily see which individuals are participating in which activities and pass along relevant information.
Allocate Resources More Effectively
With Gantt charts, you are able to allocate resources to certain tasks and members more effectively. Since Gantt charts allow you to have a total view of your project’s timeline, you can easily see where and how resources are being allocated. Another advantage of Gantt charts is that they also have a delegate feature which allows managers to delegate resources and align them appropriately with task objectives.
Get a Better Understanding of Task Dependencies
Another benefit of Gantt charts is that you are able to see which tasks are dependent on others. Without the use of Gantt charts, this can be difficult to manage and it is easy to lose track of which task depends on others. But thankfully, with Gantt charts, even complex and intricate projects can easily be tracked and understood. The overview layout of Gantt charts allows you to see which tasks are dependent on another and allows you to schedule them in certain ways so they do not hinder the overall progress of the project.
How to Create a Gantt Chart with Construction Project Scheduling Software

Jonas Construction Software uses Gantt charts to make project scheduling a breeze. With Jonas, the first step in creating a Gantt chart for your construction project is simple.You need to create a list of various tasks, deliverables, and milestones between project start and completion. You can do this by importing all cost codes for that project to act as your task list, and/or create tasks manually. You can also group tasks based on the construction project phases such as preconstruction, construction, and closeout. As soon as you add a task, it appears in the Gantt chart.
The second step is to specify a timeline for the work required to get the job done. Jonas Construction software makes this process easy. Simply click on the Gantt chart to add a task below the date you’d like to schedule your task, then click and drag to adjust the task duration.
At the next step, you create relationships between tasks. You cannot install roofing before the walls have been erected, right? That’s why relationships are an important part of construction project scheduling. When you create relationships between tasks, you ensure that work happens in the proper order. You always know which task starts when another one has been completed. At a single glance, everyone gets a clear idea of how each task impacts others. In Jonas, relationships appear as arrows connecting tasks on the Gantt chart.
Finally, work is not going to do itself, so you need the right people to complete the tasks. Once you have plotted all your project tasks and connected them with relationships, it’s time to assign resources to the tasks. At this step, you will assign every task and milestone to a specific person or team. This gives you clarity into important deadlines and task assignments.
There are many construction-specific functions in the Jonas Project Scheduler and its Gantt chart view of the project. Let’s explore this further..
Construction-specific Gantt chart in Jonas
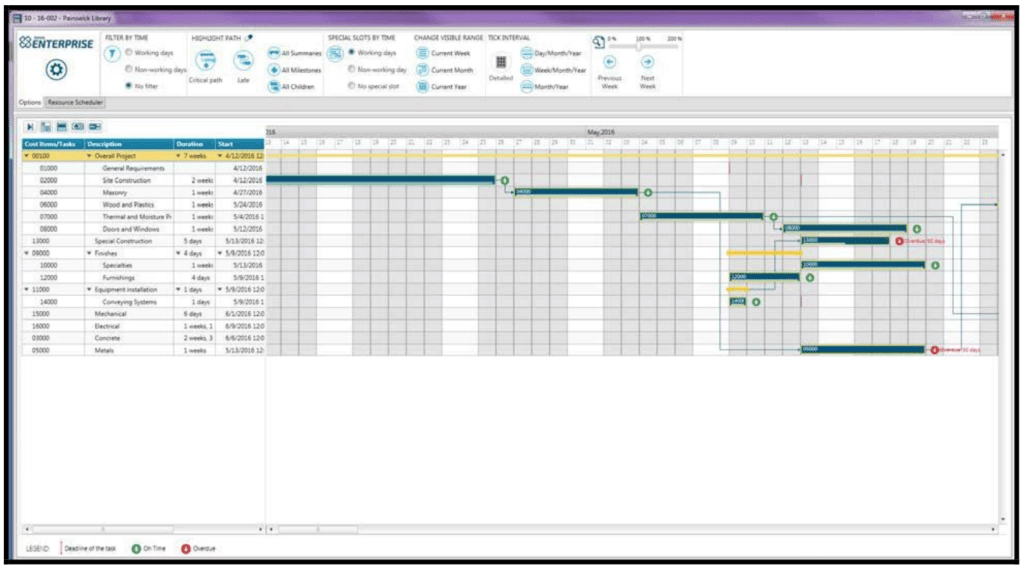
The main Gantt chart shows tasks with their relationships, parent-child hierarchy, dependencies, and task statuses.
By default, the left side grid displays the list of tasks with cost items, description, start and end date associated with the task, as well as the progress of the task and its status. Note that the columns visible here can be changed based on the View Settings configuration. The right side is a visual representation of the task timelines and their relationships to other tasks.
How to Navigate the Gantt Chart in Jonas
Tasks
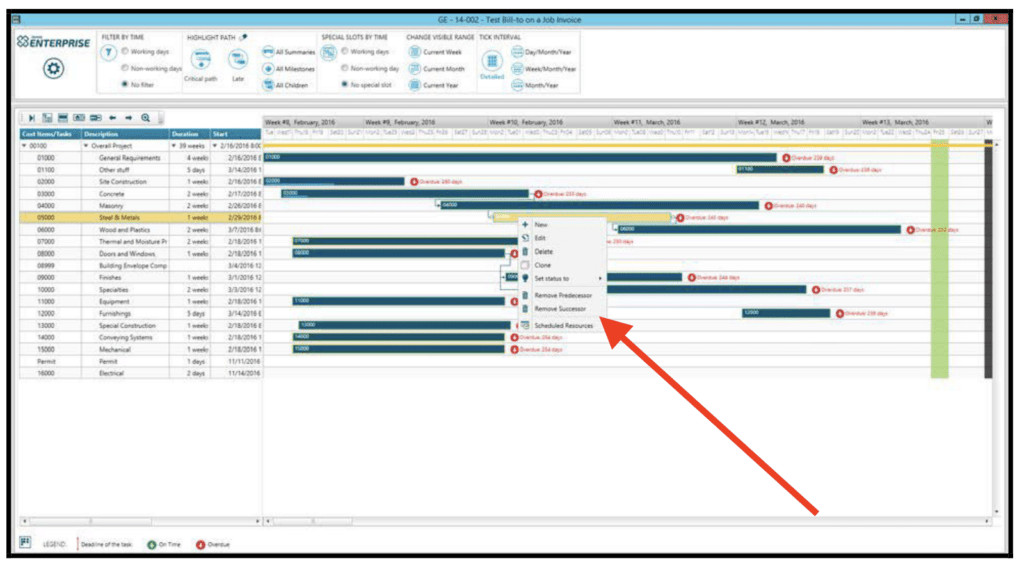
Double-click (either on the left side or on the bar) to open a task and make any desired changes. You can also right-click on a task and make a selection from the drop-down choices.
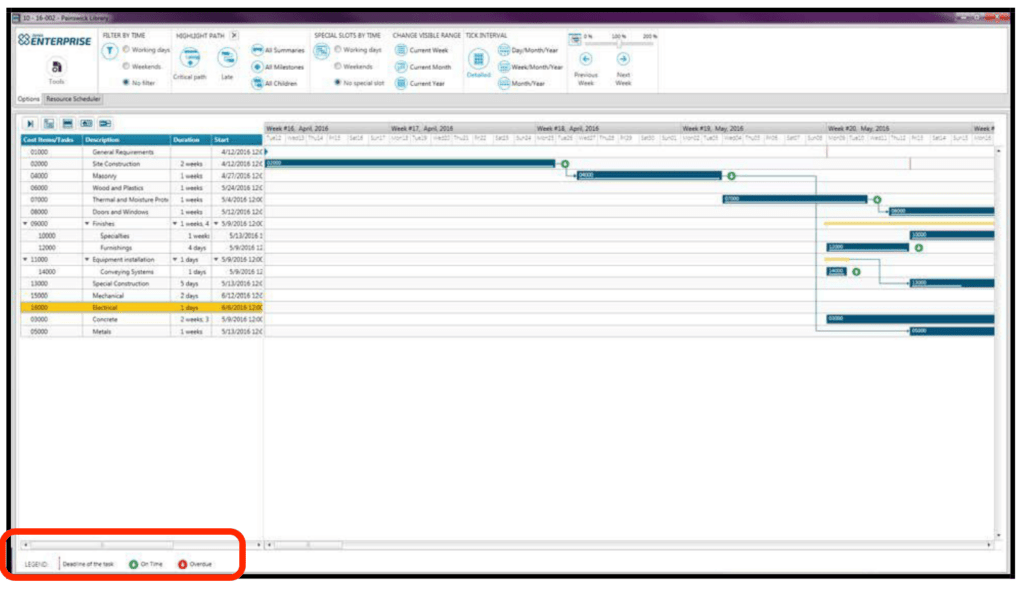
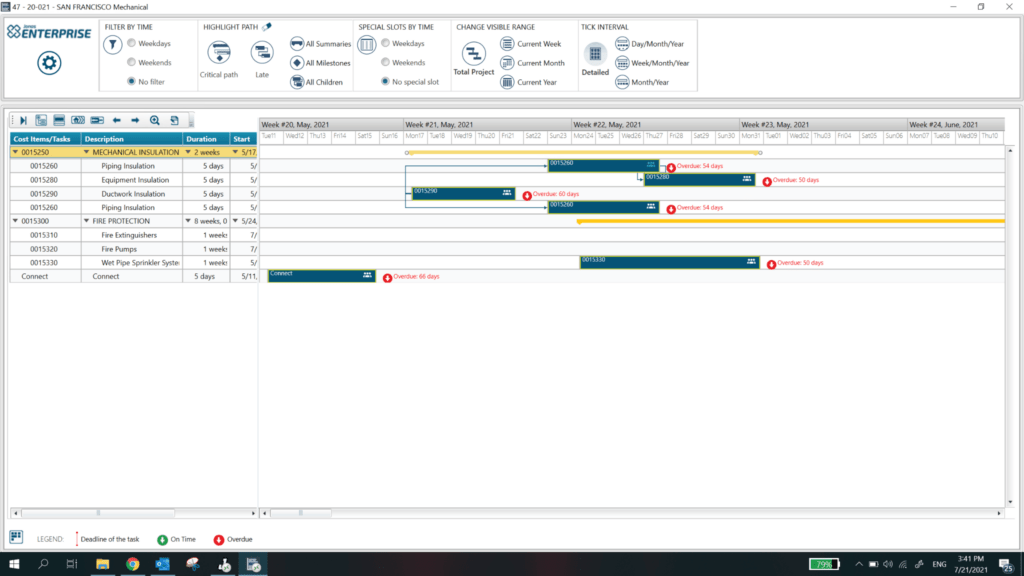
Legend
The legend at the bottom-left corner of the Gantt chart displays the following:
- Deadline of the task: If a deadline date is specified on a task, the deadline of the task will show with the vertical line.
- A task is considered overdue when its finish date has gone beyond the current date or if there is a deadline defined for the task and the progress of the task is not 100% complete.
- Overdue hours will be calculated as the current date/time minus the scheduled end date if the task is not marked “Complete”.
- Tasks that are on time will have a green arrow at the end and those that are late will have a red arrow, showing that they are overdue.
A task is either On Time or it is Overdue:
Project Scheduler Tool Box
The Tool Box area of the scheduler is used to control the presentation of information in the Gantt Chart dynamically.
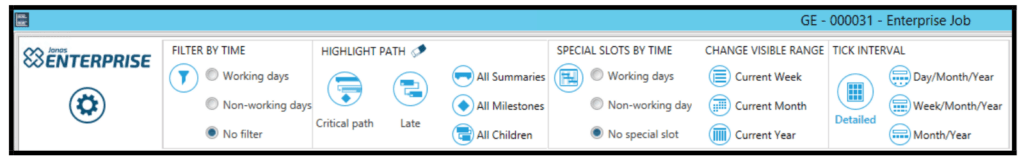
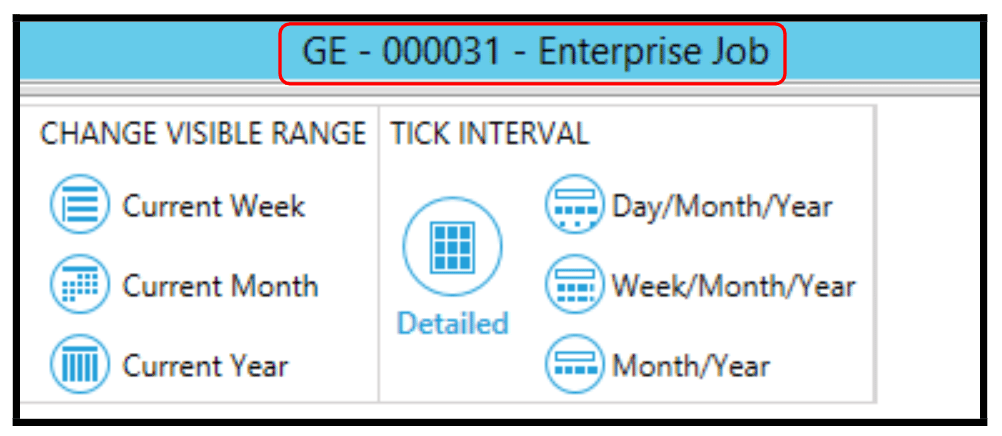
Company Code, Project Code, and Project Description are located at the top center of the Tool Box title bar:
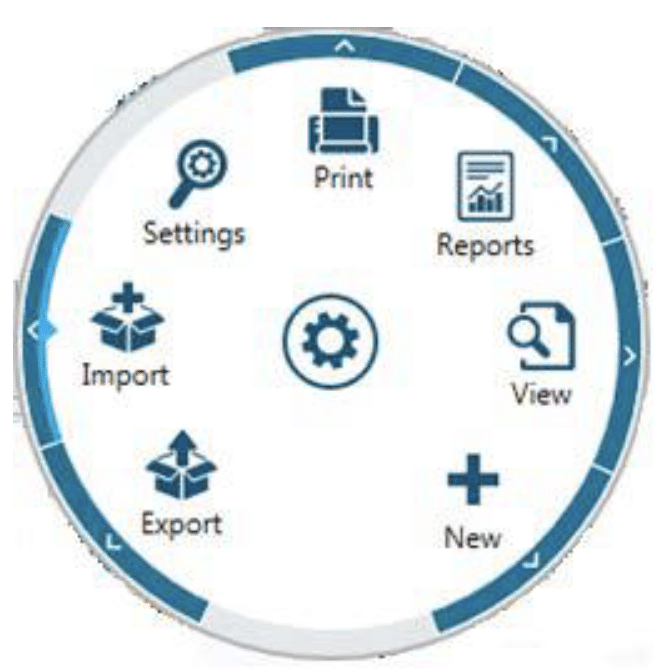
The Project Scheduler Radial Menu opens up to provide the User access to Settings, Print, Reports, View, New, Export, and Import.
Highlight Path
This is a useful function that helps to quickly identify tasks that meet selected criteria. If an option is selected, you can remove the highlighting by pressing the eraser button.
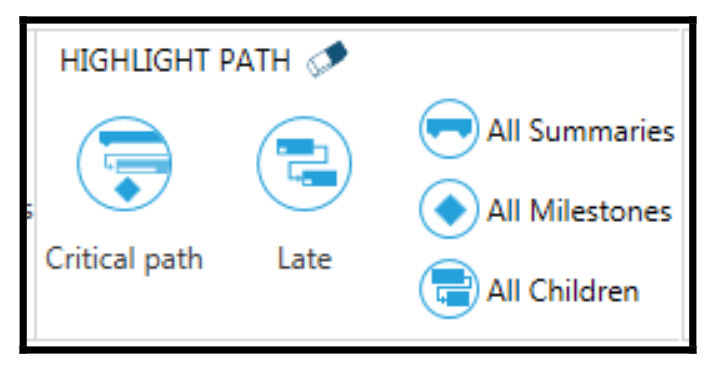
Critical path will highlight all critical tasks in a Gantt view with deadlines that are not yet completed or are overdue.
Late will show tasks that are now late.
All Summaries will highlight parent tasks.
All Milestones will highlight milestone tasks.
All Children will highlight child tasks, that is, those that are attached to a parent.
There are many other options to present data depending on your unique project needs.
The Resource Scheduler appears at the bottom left-hand corner of the Project Scheduler, and when opened, it can be pulled up to view below the Gantt Chart.
Cloning tasks
Tasks can be cloned by right-clicking on the task in the Gantt chart. When a task is cloned, all children and predecessors are also cloned, however, appointments are not. This can be a useful tool when one is scheduling repetitive work (for example, typical floors.)
The best practice would be to create a parent task as the overall identifier of the repetitive task, say, ‘Concrete 1st Floor.’ Next, set up all the individual tasks/steps such as slab, reinforcing steel, columns, walls, stairwells, etc.
Once you have cloned the parent and its children, you may want to adjust the dependencies to make the 2nd floor, for example, dependent on the 1st floor being finished:
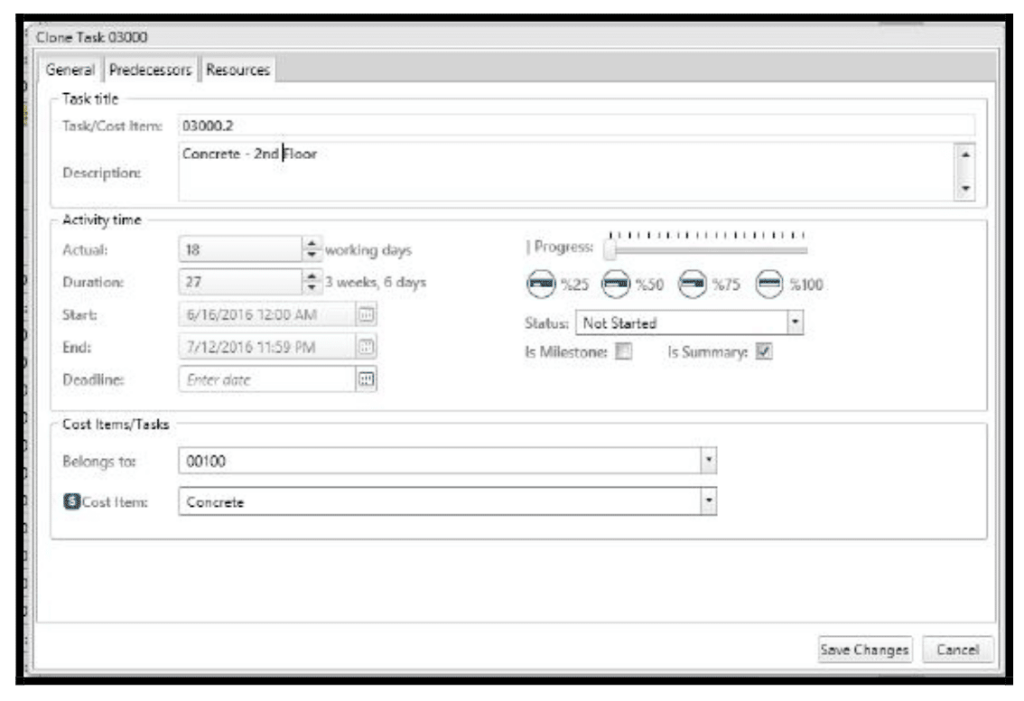
Each of the tasks on the typical floors has the same relative duration and position, keeping the individual dependencies.
Examples of Construction Gantt Charts
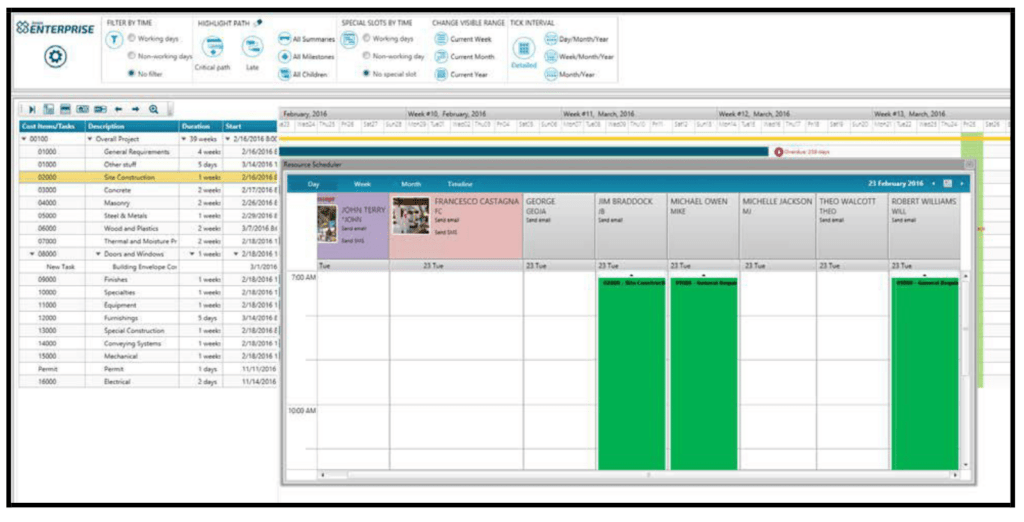
In Jonas Project Scheduler, you can easily track milestones, view start and finish dates, as well as any number of days that a project phase is overdue.
See the workload for each technician or employee to better plan their schedules. For example, you can customize the Tick Interval(the intervals you want to see on the Gantt chart) showing days, weeks, or months. To highlight weekends or weekdays on the Gantt chart, you can add Special Slots.
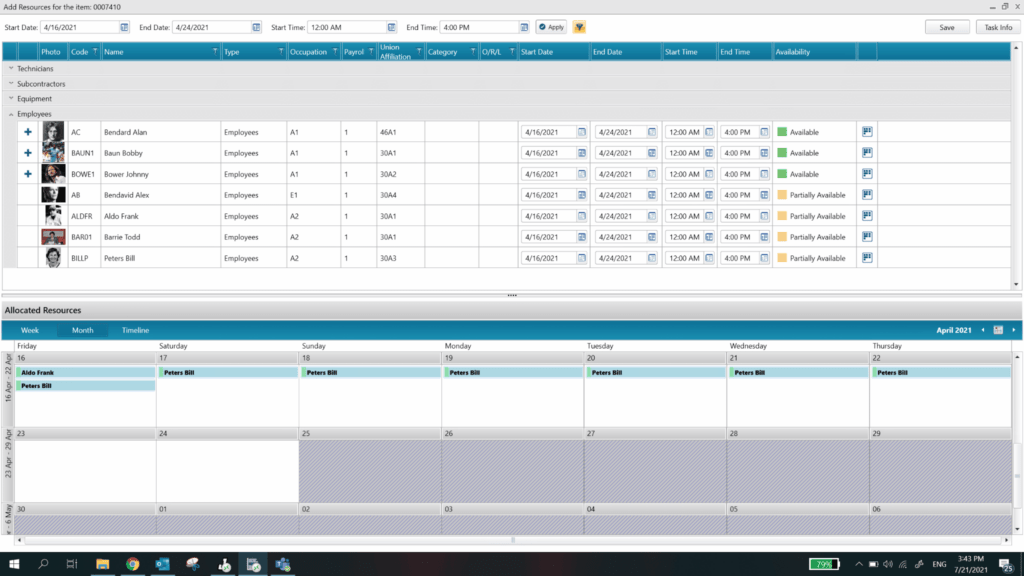
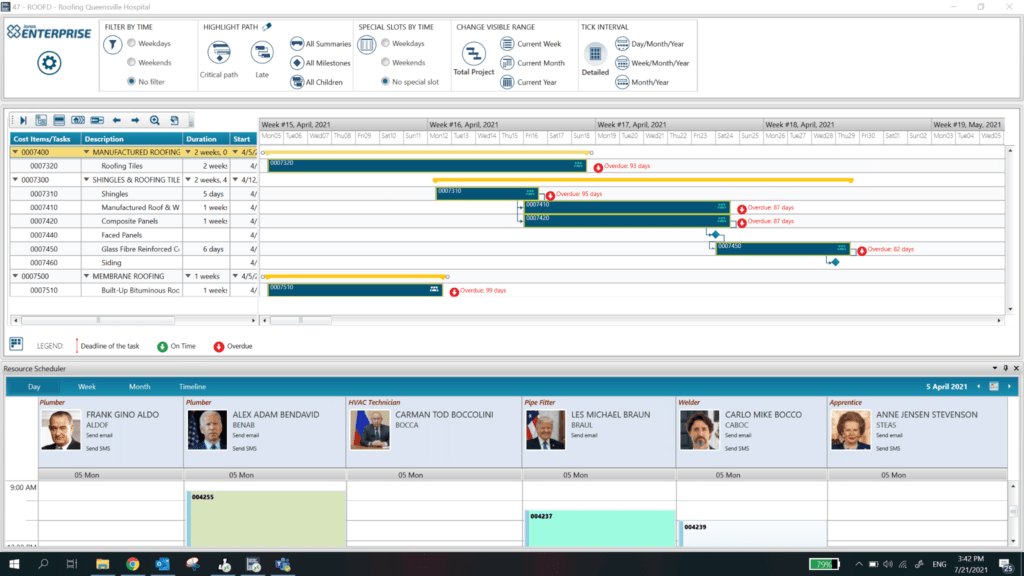
Resource scheduler allows you to schedule out your resources – technicians, subcontractors, equipment – and allocate them against each task. This allows you to keep track of all your resources and easily assign them to tasks.
Jonas Construction Software Makes Job Scheduling a Breeze
With Jonas Construction Software, inefficiencies and frustrations become a figment of the past. Our software is designed for those in the construction industry. We understand many of the limitations that companies face with their software. It is because of this understanding that we have specifically created our programs with features such as Gantt charts. We intentionally integrated the benefits of Gantt charts into our job scheduling software to help construction companies complete jobs more efficiently and effectively.
Not only can our job scheduling software be seamlessly integrated into your systems, but it is also incredibly user-friendly. Contact us today to find out more information about our innovative and practical software features.